|
Temporary Work _______ So much of the work has been about the relationship of a chord vs. a circle. It has proven to be an interesting idea that can be built upon. From the chord vs. circle to a parabola that describes a circle. To a theory or hunch that explains circular functions such as the sine and cosine. Einstein said the World and God’s Work should be able to be explained in a simple manner that everyone could understand. (This quote is paraphrased.) But in higher mathematics such as calculus sometimes the answer seems to be placed in a puzzle of equations that is difficult to understand the method entirely. But it seems the most useful of knowledge in calculus are those parts that are easily understood. The parts of calculus that are most basic are used as “tools” to solve what is more difficult to calculate. However the important thing to note is that these tools, no matter how logical or basic they may appear, had to be discovered. They are easy to understand, yes, but the discovery of these tools, and any tools we use in life, is a great challenge. A challenge that influences how we see the World. A World that reflects our lives. So to create a math problem is no simple thing. It is just one thing in our lives that we use tools for. The concept to remember about math is to keep ideas simple. It is no easy task when sometimes math concepts are not tangible. The mathematician has to take the information that doesn’t seem to relate and draw comparisons from it. In calculus many solutions to problems can be found graphically. And sometimes still elementary mathematics can do the same job. _____________________________________________________________________________ Theory Only: Doesn’t Work — But the idea is intriguing! Unfortunately, in this group of theories (which probably don’t work) trying to explain a simple concept was taken to a complicated way of doing math. Some calculus was used. But the simplicity comes when apply this knowledge to a problem and not its informal prof. The Problem: A tank contains 1000 liters of pure water. Brine that contains 0.1 kg of salt per liter enters the tank at a rate of 10 liters per minute. The solution is kept thoroughly mixed and drains from the tank at the same rate. How much salt is in the tank after 6 minutes? This problem is solved using calculus refer to mixture problem. Admittedly a relatively difficult problem to fully understand. But is there another solution? One that would be easier once how to determine the answer once the steps were established. An approach that would show the same problem graphically. _____________________________________________________________________________ Solution: _______ Imagine the rate of change of the salt tank as the rate of change of the circle. That is the circle that is described by the parabola. The integral is only necessary to describe equations and set up the equation with the rate of change of salt leaving the tank. The goal is to find the equation the equation of the parabola. The known parabola will be modified similar to a way that a sine curve is modified to fit different applications.
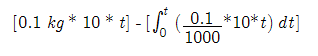
_______ [salt already in tank at time t] - [summation of salt leaving the tank]
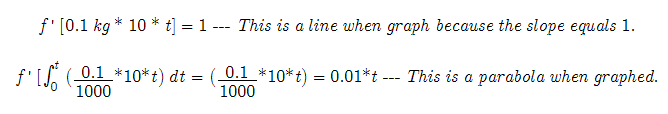
This is the equation of problem. It is also the graph. However it is not in useful form. The derivative of the equation is taken to find the slope. The slope is the tool we are looking for.
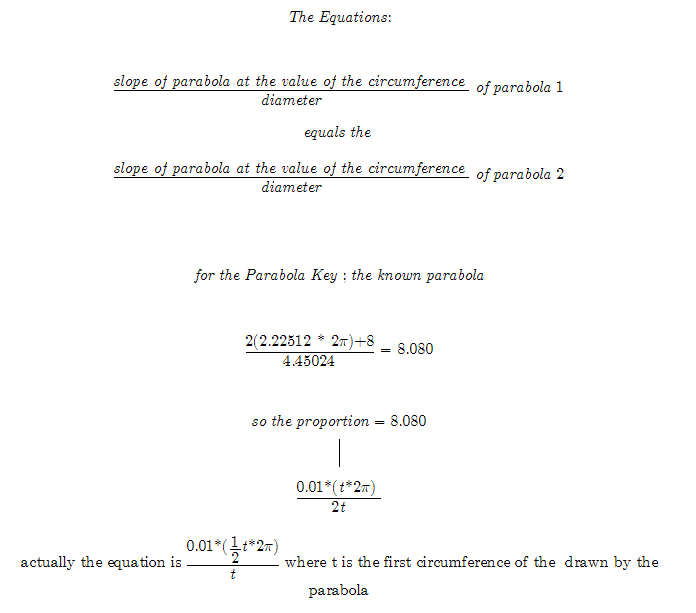
The graph of the line minus the graph of the parabola tells how much salt is in the tank at the given time. --- But to put this equation of into a form that can be graphed we must find a way to explain a parabola using the slope. It is similar to finding the slope of a line, however it is difficult to determine how slope effects a parabola. Using basic algebra we could plot both the line and the parabola from their slope assuming they start at origin (0,0). The relative distance between the line a parabola would be equal to the value we would have if they were subtracted from each other. That is subtract the actual line by the parabola. A new parabola is then formed and its values answer the question of how much salt is in the tank (and how much left) at time t. _______ In an attempt to find some relationship between a parabola and its slope, the follow hunch was envisioned. Remember that it is only a hunch and as such is only a idea brainstorm that shows the process of attempts at reaching an answer. The parabola that describes the salt tank will be compared to the "Parabola Key" parabola we already know the values for. Here is an example using the "Parabola Key" and the above salt tank problem. It is formed on the basis that a circle (in the form of an involute) is described by a parabola. The fact is that because circles are proportional to each other and a parabola defines a specific circle, this knowledge can be used to relate the slope of the parabola to another parabola. Here is the hunch without testing it in a problem. It is only to show a possibility of little discoveries that are hidden in simple algebra and geometry.
However the equation does not give a correct answer. That does not mean that there isn't something important to be noted here. It justs means the problem is a hunch. This is presented to augment future work on the problem. Well since both the parabola and circle have similar, proportional relationship between a circle and parabola of different sizes, can an equation of this relationship be found?
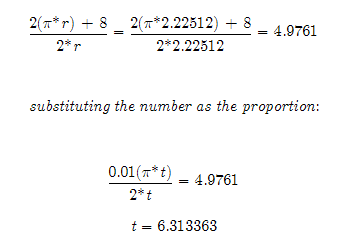
_______ Since the involute formed by the measurements of the known parabola (The Parabola Key) may form a common proportion that relates to all parabolas, the following equations are formed. The involute increases by a given rate per every Pi radians. This rate will be used to describe the equation of the parabola of the salt tank.
So in the involute that is based on the parabola's measurements we have a radius of 6.3134. This is also the length that the radius of the involute increases per Pi radians, along the involute. This is an interesting number. However not that this is just a hunch. Much testing and checking of the values needs to be done. This will take quite some time. So instead of not updating the Hunches section, I left an intriguing problem which although has a writeup that is difficult to follow, could lead to more ideas when worked on by more mathematicians. May the Creative Force be with You! Attention: It is important to understand this
may not work. It is only to outline an idea and create a problem to
work on. The relationship and proportions between slope, parabolas, and circles are interesting. This problem is presented to create interest in those areas. And quite possibly make a little math discovery. |